Big CSVs
In this post we'll analyze larger-than-memory CSV files.


Big data is an overloaded term. Here at Julia For Data Science, we'll loosely define it as:
Big data is any dataset (or collection of datasets) that requires you to change how you analyze it because of its size.
For example, I am writing this post on a laptop with 8GB of memory. If I'm trying to analyze a 10MB CSV, I can easily load that into memory and run my analysis. If I have a 10GB CSV, I need to change my approach because I can't load all the data at once.
For Small CSVs: CSV.File 📄
The CSV package is a high-performance Julia package for working with CSV files. For smaller (comfortably fitting in memory) datasets, you can get started with CSV.File("path/to/file.csv") .
- This creates a
CSV.Fileobject that can be loaded into many kinds of "sinks", such as aDataFrame. - A
CSV.Filewill automatically determine the types for each column. - There are many options available to help you read CSVs with different formats.
Here's a quick example of loading data a CSV from the web (New York Times' COVID data), loading it into a DataFrame, and making a plot:
using CSV, DataFrames, Plots

url = "https://raw.githubusercontent.com/nytimes/covid-19-data/master/us.csv"

file = CSV.File(download(url))

df = DataFrame(file)

plot(df.date, df.cases, title="Cumulative COVID-19 Cases in the US",
	lab="", ylab="N", xlab="Date")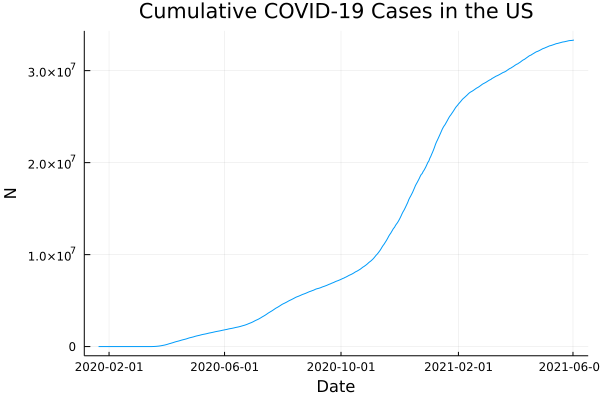
For Big CSVs: CSV.Rows 🚣
You can also create a CSV iterator that only loads one row into memory at a time, allowing you to work with huge CSVs. CSV.Rows is similar to CSV.File, but it does not infer types. When you iterate over CSV.Rows, all data is represented as a String. Thus, you must manually parse the data into its appropriate type.
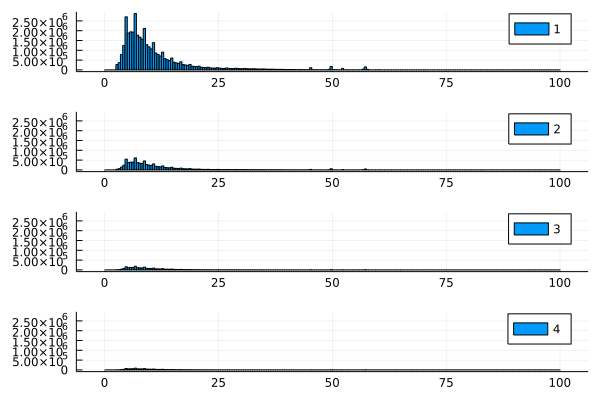
As an example, let's take a look at Kaggle's New York City Taxi training data, a 5.31GB CSV file containing data on taxi rides (fare amount, number of passengers, pickup time, and pickup and dropoff locations). Note this isn't actually larger my laptop's memory, but we are trying to keep our examples easily reproducible.
We can't plot all the data directly since we aren't loading it all at once, so what can we do?
CSV 🤝 OnlineStats
OnlineStats is a Julia package that provides fast single-pass algorithms for calculating statistics and data visualizations on big data. Every statistics algorithm in OnlineStats uses constant memory, so it can be used on infinitely-sized data!
We'll use OnlineStats together with CSV.Rows to run our analysis. Note that the CSV and OnlineStats packages don't depend on each other, but they work well together because of Julia's composability. Let's take a look at the distributions of fare amount, grouped by the number of passengers.
using CSV, OnlineStats, Plots

# `reusebuffer=true` lets us reuse the same computer memory for each row
rows = CSV.Rows("/Users/joshday/datasets/nyc_taxi_kaggle/train.csv",
	reusebuffer=true)

# Create an iterator that parses the types
itr = (parse(Int, r.passenger_count) => parse(Float64, r.fare_amount)
    for r in rows)

# OnlineStats works with any iterator
o = GroupBy(Int, Hist(0:.5:100))

fit!(o, itr)

# Plot results for 1-4 passengers
plot(plot(o[1]), plot(o[2]), plot(o[3]), plot(o[4]),
    layout=(4,1), link=:all, lab=[1 2 3 4]
)
🚀 That's It!
You can now calculate statistics and run an analysis on a big CSV file using the CSV and OnlineStats packages.
What do you want to learn about next? Ping us on Twitter at @JuliaForDataSci!
Enjoying Julia For Data Science? Please share us with a friend and follow us on Twitter at @JuliaForDataSci.